


Work with your team to answer Questions 1 and 2. Make sure all team members record the answers in their technology notebooks. Then work by yourself to answer Question 3.
Burt is trying to make sense of the class averages. He wrote his first impressions below. Copy this paragraph into your technology notebook. Then, add to, subtract from, or change Burt’s initial ideas to reflect your observations. Use a different-colored pen to show these revisions in your technology notebook.
Your class averages tell a story. They tell about how the amount of oil and water removed changes when you change your sampling rate.
- Write one or two sentences that tell the story of your class averages.
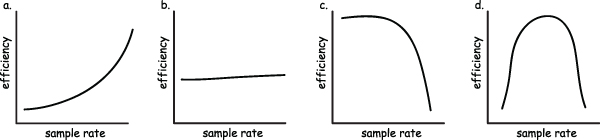
- Which of the following graphs best tells the same story you told in Question 2a? Write down your thinking.
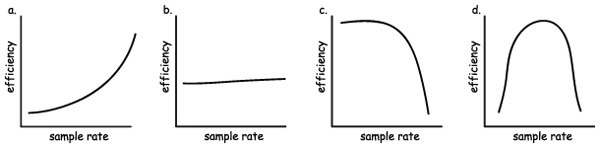 Figure 3-9: Efficiency versus Sample Rate. Which sketch graph answers Question 2b?
Work by yourself to answer the following question. Answers such as “all of it” or “none of it” limit how we can grow from experience. Be specific and justify your answer.
- What part of this activity was easiest to understand?
- What part was hardest to understand?
- Advise your teacher on how to help you make sense of activities like this one.
The class averages show how fast you can remove oil. One sample every 20 seconds is faster than one sample every 5 seconds. The averages also show how efficient the removal was. Removing lots of oil with lots of water is more efficient than removing lots of oil with a little water.
Answers to Reflect and Connect
Students should work with their teams on the first two questions. Emphasize that all team members need to have the answers written in their technology notebooks. Students should work individually on the last question.
-
Burt is trying to make sense of the class averages. He wrote his first impressions below. Copy this paragraph into your technology notebook. Then, add to, subtract from, or change Burt’s initial ideas to reflect your observations. Use a different-colored pen to show these revisions in your technology notebook.
The class averages show the average of how fast you can remove oil. One sample every 20 seconds is slower than one sample every 5 seconds. The averages also show how efficient the removal was. Removing lots of oil with lots of water is less efficient than removing lots of oil with a little water.
-
Your class averages tell a story. They tell about how the amount of oil and water that is removed changes when you change your sampling rate.
- Write one or two sentences that tell the story of your class averages.
-
Which of the following graphs best tells the same story you told in Question 2a? Write down your thinking. (See figure T3-4.)
Choice C is correct because it has a line that decreases from left to right. This means that as sampling rate increases, efficiency decreases. None of the other graphs show this principle and only this principle.
When we increased the sampling rate, the efficiency went down.
-
Work by yourself to answer the following questions. Answers such as “all of it” or “none of it” limit how we can grow from experience. Be specific and justify your answer.
- What part of this activity was easiest to understand?
- What part was hardest to understand?
Answers will vary, but should all contain reference to a specific part of the activity.
- Advise your teacher on how to help you make sense of
activities like this one.
Look for sincere comments and by all means take the advice if, in your professional judgment, it will help students understand.
Answers will vary, but should all contain reference to a specific part of the activity.