


Work by yourself for at least five minutes on each of these questions. Then compare your progress with two classmates. From your discussions, complete each answer.
-
Read the following dialogue about text messaging. Then complete the tasks in Questions 1a–c.
PARENT: I think you’re texting too much.
TEENAGER: Whatever.
PARENT: Seriously. The more you text, the less time you have for homework.
TEENAGER: Something tells me I have some explaining to do.- Devise a plan for testing the parent’s idea stated in line 2. Pretend it is easy for you to survey 100 teenagers. These surveys will tell you how many minutes per day 100 teenagers spend doing homework and texting.
- Sketch a graph of the data you think your survey will show. Plot your estimates of “minutes texting per day” on the x-axis. Plot the amount of “minutes per day doing homework” on the y-axis.
- Select an amount of texting and homework time you would like to have. Defend your choice. Do this by explaining your choice to this parent. Your explanation will have a claim, evidence, and reason based on principles found in trends.
-
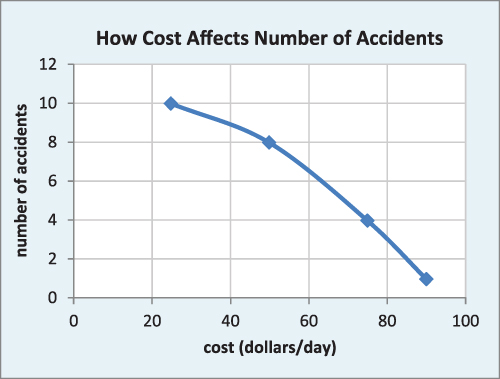
Dorsey is a chief safety engineer for an oil company. She collected industry-wide data related to accidents involving oil refining and transport. She collected the data shown in figure 3-14. Her table data show the costs related to those accidents.
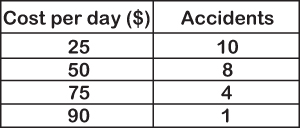 Figure 3-14: Cost per day and number of accidents. Use this table to answer Question 2.
- Dorsey graphed her data. (See figure 3-15.) Help check her work by making additions, deletions, and corrections. Directly next to each revision, explain why you made that revision. Sketch Dorsey’s graph in your technology notebook. Make revisions there in a different color. Hint
- An insurance company auditor visits Dorsey. He says Dorsey’s company should only average 60 accidents for $25 per day. Her company actually has more. Help Dorsey take a position and explain it. You can agree or disagree with the auditor. But your explanation must have three parts: claim, evidence, and a reason based on the relationship between cost and accidents.
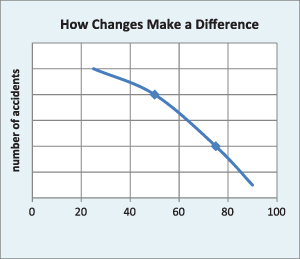 Figure 3-15: Cost per day versus number of accidents graph. Use this graph to answer Reflect and Connect Question 2a.
 -
Think about what you do to make effective explanations. Think about where you use them. One place you will use them is in business.
- What do you think is the most difficult part of making an explanation: claim, evidence, or reason? Give details.
- What part of constructing an effective explanation makes you feel good? Why does it make you feel good?
Answers to Reflect and Connect
Allow students enough time to work by themselves to answer the questions and then revise their answers based on talks with a classmate or two. Then hold a class discussion about their answers.
-
Read the following dialogue about text messaging. Then complete the tasks in Questions 1a–c.
PARENT: I think you’re texting too much.
TEENAGER: Whatever.
PARENT: Seriously. The more you text, the less time you have for homework.
TEENAGER: Something tells me I have some explaining to do.- Devise a plan for testing the parent’s idea stated
in line 2. Pretend it is easy for you to survey 100
teenagers. These surveys will tell you how many minutes per
day 100 teenagers spend doing homework and texting.
Students could say that they would make a survey and give it to 100 teenagers. The survey would ask them to report how many minutes per day they spent texting, how many minutes per day they spent doing homework, and what their GPA was. Then they would tally the results.
- Sketch a graph of the data you think your survey will
show. Plot your estimates of "minutes texting per day" on the
x-axis. Plot the amount of "minutes per day doing
homework" on the y-axis.
Accept a sketch graph. The graph does not have to be on graph paper, but should have labeled axes and reasonable estimates for numbers.
In estimating their data results, you might remind students to think about the amount of free time they really have. For example, it is not reasonable to do 15 hours of texting and 1 hour of homework. Also, you might have to give them a hint as to how GPA might be related to amount of homework time.
Most students’ graphs should show an inverse relationship—as texting increases, time to do homework decreases.
- Select an amount of texting and homework time you
would like to have. Defend your choice by explaining it to
this parent. Your explanation will have a claim, evidence,
and reason based on principles found in trends.
Answers will vary, but students should be able to provide some evidence to back up their request. For example:
Claim: I want to text 60 minutes per day and do 60 minutes of homework per day.
Evidence: When I plot 60 minutes per day of texting and 60 minutes of homework, my point is above the trend line from what other teenagers do.
Reason: Above the trend line means I’m doing more homework than average. If my request was below the trend line, this would say I was spending less time on homework than the average teenager. Because I’m doing more, my request is fair.
Note: If students say they want zero homework, help them think about this. Ask them if it is a reasonable answer. Lead them to select at least some amount of homework.
- Devise a plan for testing the parent’s idea stated
in line 2. Pretend it is easy for you to survey 100
teenagers. These surveys will tell you how many minutes per
day 100 teenagers spend doing homework and texting.
- Dorsey is a chief safety engineer for an oil company.
She collected industry-wide data related to accidents involving
oil refining and transport. She collected the data shown in
figure 3-14. Her table data show the costs related to those
accidents.
- Dorsey graphed her data. Help check her work by making additions, deletions, and corrections. Directly next to each revision, explain why you made that revision. Sketch Dorsey’s graph in your technology notebook. Make revisions there in a different color.
- An insurance company auditor visits Dorsey. He says Dorsey’s company should only average 60 accidents for $25 per day. Her company actually has more. Help Dorsey take a position and explain it. You can agree or disagree with the auditor. But your explanation must have three parts: claim, evidence, and a reason based on the relationship between cost and accidents.
Look for justification for each revision. For example, the vertical axis did not have any numbers on the scale. We cannot plot data without an accurate scale. The horizontal axis needs a title so we can interpret the variable being tested. The independent variable (number of accidents) should be plotted on the horizontal axis, so the axes should be switched. Some data points are missing, so including them all gives us the total picture of the data. (See figure T3-6).
Answers will vary, but should supply the three parts requested. For example:
Claim: I claim that it is not reasonable to expect 60 accidents for $25/day.
Evidence: This data point lies below the industry-wide trend line.
Reason: Points below the industry-wide trend line represent fewer accidents for a given cost than is common in industry. It is not reasonable for the auditor to expect Dorsey’s company to have fewer than the average for a given cost.
- Think about what you do to make effective explanations.
Think about where you use them. One place you will use them is
in business.
- What do you think is the most difficult part of making an explanation: claim, evidence, or reason? Give details.
- What part of constructing an effective explanation makes you feel good? Why does it make you feel good?
Answers will vary. Do not accept answers such as “all of them.” Many teachers have said that getting students to offer reasons that logically and correctly link claims and evidence is the most difficult part of explaining.
Answers are subjective. Look for an indication that competence feels good. This often leads to increased self-motivation.