
Energy Technology Laboratory
You have helped Burt explain part of the oil spill cleanup problem. That part involves containing and removing as much oil as possible, before it hits the shore. After oil hits the shore, environmental impact and cost skyrocket. Other technologies are used to clean up oil spills at sea. They involve spreading the oil out (adding dispersants) and adding oil-eating organisms (bioremediation). Should those technologies be part of a cleanup solution? How could Burt learn more about these technologies?
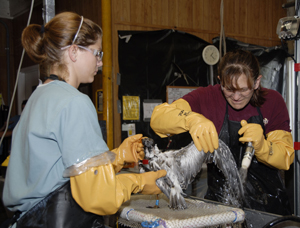
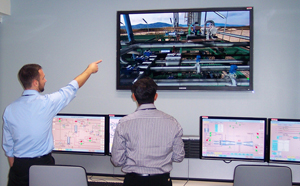
Fortunately, simulations can show how these technologies work without going to a real oil spill. (See figure 3-16.) This means simulations save money. Saving money is part of the solution to complex solutions. In this Elaborate activity, Simulate and Save, you will read about other technologies used to clean up oil spills still at sea. You will also use a simulation to understand how each technology works. Then you will explain what you understand. Materials
-
Study each of the next 3 readings. Each informs you about a different oil spill cleanup technology. You will need this information to get the most value out of the upcoming simulation. If you finish early or if you are interested in learning more about the effects of oil spills in the environment, read the sidebar Environmental Impact. Sidebar
Contain and Remove
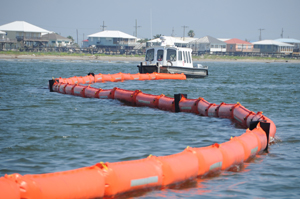
Oil spills can be contained and removed. Because oil floats on water, plastic floats attached in a long line can surround oil. These long floating lines are called booms. (See figure 3-17.) They keep oil from spreading. Containing the oil makes it easier to remove.
Skimmers use pumps and hoses to remove oil from the surface. (See figure 3-18.) Other materials soak up spilled oil for removal. These materials are called sorbents.
 U.S. Coast Guard photo by Petty
Officer 3rd Class Ann Marie GordenFigure 3-17: Booms keep oil from spreading. Containing oil spills make them easier to remove.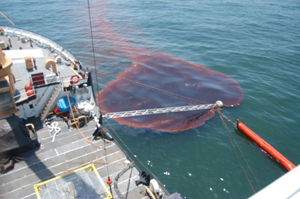 U.S. Coast Guard photo by 1st
Class Cadet Jonathan StimmellFigure 3-18: Oil skimmer. Oil on the ocean surface is removed by an oil skimmer.The major advantages of containing and removing oil include that the equipment is
- easy to use
- reliable
- fast acting, if it is readily available.
The major disadvantages of containing and removing oil include that the equipment is
- not effective in stormy weather
- difficult to use with heavy crude
- expensive
- likely to leave up to 20 percent of oil behind
- not practical for large spills.
Disperse
Wave action, wind, and currents spread out oil. (See figure 3-19). These natural actions break the oil into tiny drops of oil. These drops are surrounded by large volumes of water. The process when oil spreads out like this is called dispersal. Engineers can add soap-like chemicals to oil to disperse it. These chemicals break up oil into small drops. These drops spread out over a large area. This helps decrease the amount of damage the oil may do to the environment because there is not a lot of oil per volume of water.
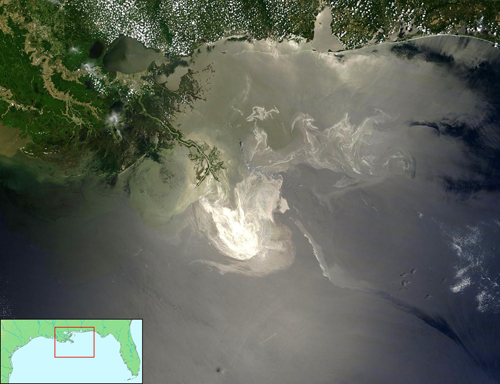 NASA/GSFC, MODIS Rapid ResponseFigure 3-19: Oil spreads out from the Deepwater Horizon leak. Oil from the Deepwater Horizon leak affected much of the coast from Texas to Florida.
The major advantages of dispersing oil include that chemical dispersants are
- easy to apply
- relatively inexpensive
- effective on large spills
- fast acting.
The major disadvantages of dispersing oil include that chemical dispersants are
- toxic in some situations
- redirecting oil to the water column and ocean floor rather than removing it
- not highly effective for heavy crude oil.
Bioremediation
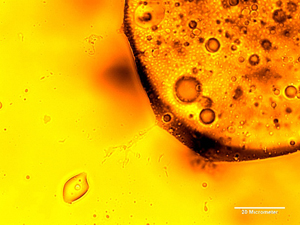 Lawrence Berkeley National LabFigure 3-20: Some organisms eat oil. Bioremediation uses organisms that consume oil as a food source.
Some organisms eat oil. Many of these bacteria and fungi occur naturally. Biologists can also grow especially effective strains of these oil-eating organisms. (See figure 3-20.) These bacteria and fungi can be added to oil spills by cleanup crews. This process is called bioremediation (BYE oh ri mee dee Ay shun). Oil-eating organisms use oil as food. They convert oil to natural waste products.
The major advantages of bioremediation include the following:
- It is easy to apply.
- It is relatively inexpensive.
- It is effective on large spills.
- It removes the oil instead of moving it someplace
else.
- It continues to work without human supervision.
The major disadvantages of bioremediation include the following:
- It requires fertilizer, which can damage the
environment.
- It is slow acting.
- It requires experts to select the best organism for
each spill.
-
Spend a few minutes running the Oil Spill Technologies simulation. Get a feel for how constraints affect the oil spill. Use the mouse or touchpad to investigate how to
- select different technologies
- choose different kinds of oil
- determine the size of the spill
- set the distance from shore for the spill. Hint
Be sure all teammates have a chance to run the simulation.
- select different technologies
-
Prepare to make sense of what you see. Do this by recording your observations. Use colored pencils in your technology notebook to show changes in the
- thickness of the oil spill
- diameter of the oil spill
- shade of the oil spill Hint
- thickness of the oil spill
-
Decide what your observations mean. First, write statements a–c in your technology notebook. Then revise each statement. Use trends or patterns you observed from the simulation. Hint
- When the thickness of an oil spill decreases, its
diameter remains the same.
- Bioremediation works by dispersing the oil.
- Removing oil does the same thing as dispersal.
- When the thickness of an oil spill decreases, its
diameter remains the same.
-
Check your revisions with one other team. Use the Think-Share-Advise-Revise (TSAR) strategy to compare your work. If you still have questions when you finish, consult with your teacher. Hint
Activity Overview
In the Elaborate activity, Simulate and Save, students expand their problem-solving skills. They apply what they learned about constructing explanations to two other oil spill cleanup technologies. In this way, students practice solving parts of complex problems. To accomplish this, students read about other oil spill cleanup technologies. Then they use a computer simulation to understand how each technology affects the oil spill. Students apply what they learned from the Explain activity to form an explanation of how each technology works.
Before You Teach
Background Information
Oil spills generally are dealt with in two phases: before landfall and after landfall. The costs and environmental damages associated with an oil spill that hits or gets very close to shore are many times greater than oil spilled out at sea. Thus, there is incentive to clean up as much oil as is technologically possible before the oil reaches shore.
Three groups of technologies are used in cleanup efforts.
Mechanical methods contain and remove oil. Floating booms corral oil and make it easier to collect and remove. Mechanical removal at sea usually involves skimmers that use various devices to selectively separate the floating oil from the water. Pumps attached to hoses, weirs, sorbents, and rollers all skim oil into a collection tank. Mechanical methods usually leave up to 20 percent of the oil at sea.
Dispersing agents break the oil into tiny droplets. These droplets spread out and can be decomposed by naturally occurring organisms. Tiny oil droplets evaporate more easily than large ones. Many dispersing agents are toxic to marine organisms. Debate continues regarding the relative toxicity of dispersants.
Bioremediation uses oil-eating organisms to remove oil. One drawback is time, because this process usually takes weeks to months. Another drawback is fertilizer. These organisms need supplemental fertilizer and dispersants to be effective. Both fertilizers and dispersants have negative environmental consequences.
This activity uses the Oil Spill Technologies simulation to model a circular oil spill at sea. Students see a top or bird’s-eye view, as well as a side view of the spill. Oil removal methods can be selected to decrease the amount of oil. The more oil that is removed in the simulation, the more the diameter of the oil slick decreases, although its thickness, or concentration of materials, decreases only slightly.
The simulation also allows the user to select dispersal methods. Dispersal will enlarge the slick's diameter, but it will look lighter in color because the thickness of the oil slick decreases. Selecting bioremediation will remove oil, which results in dispersal of the remaining oil.
It is important to remember that removal takes oil out of the ocean. Dispersal does not. Adding dispersing agents, in the short term, spreads the oil out and away from the coastline to the water column and ocean floor. The same amount of oil remains, but the visual impact is less evident.
Materials
For each class of 30 students:
- access to the Oil Spill Technologies simulation on a computer
- pens or pencils of different colors
Advance Preparation
Students will need access to computers for two class periods to complete this activity and perhaps two more for the Evaluate activity. Make sure you have reserved computers or the computer lab in advance, if necessary.
As You Teach
Outcomes and Indicators of Success
By the end of this activity, students will
-
learn about oil spill cleanup technologies.
They will learn about these technologies by completing three readings: Contain and Remove, Disperse, and Bioremediation.
-
use a computer simulation to help explain how oil spill cleanup technologies work.
- collecting simulation data on how oil spill thickness, diameter, and shade depend on various constraints
- analyzing simulation data for trends
- explaining how each trend relates to the technology involved.
-
gain experience using computer-based simulations.
They will show their experience by determining the effect of various constraints on the model oil spill.
They will demonstrate how simulations help explain by
Strategies
Getting Started
Have students look at the chapter organizer to see the key ideas they have already learned and what they will be learning. Remind them that they are helping Burt solve a complex problem by breaking it down into smaller parts. Now it is time to learn about other parts of a possible solution. Discuss the good business sense involved with using simulations instead of collecting data in the field. If the simulation is based on data someone else has already collected, then simulations can save substantial amounts of money. In this way, learning how to use simulations represents a very practical real-world skill. This will give some students a stronger sense of purpose and increase self-motivation.
Process and Procedure
-
Select a reading strategy that fits your students.
-
Allow students time to get used to the simulation. Many of them will be used to drop-down menus. They will see various choices under each drop-down menu. These choices represent either different cleanup technologies or constraints commonly faced by engineers involved in oil spill cleanups. Each set of constraints produces a different result when they run the simulation. For each run, the simulation stops when the oil slick hits the outer perimeter of the view frame. This represents oil hitting shore. A Total Cost bar and the Relative Time also change with each set of constraints. Students use these values in the Evaluate activity. The primary point of this activity is to become accustomed to the simulation and to use it to explain how technologies work. A final cleanup recommendation will not come until the Evaluate activity.
This simulation allows students to collect time data for each oil spill scenario test. The clock in the bottom center of the simulation page does not have numbers. The learning intent is for students to explore the concepts of scale and thus relative time. Students are used to clocks (and most other instruments) having numbers by each mark or a digital display that “tells” them the number associated with the measurement. In the clock instrument here, students must grapple with how to first measure and then compare the amount of time for each run. In doing this thinking, students develop an association between instrumentation and the measurement being taken.
Teachers might consider simply waiting for students to notice that the clock has no numbers. This is a “need to know” moment. Students want to know how to measure, record, and display time in any charts they make, but they don’t have numbers. Teachers can ask, “What do you think we should do about this?” Then teachers can use this entry as a springboard for inquiry into the concept of scale. The primary point is that the scale is initially arbitrary. That is students can make the divisions stand for just about anything they want. In this clock, each yellow wedge could stand for an integer (1, 2, 3, etc.), but not a specific number of hours. Thus, some oil spills require relatively large amounts of time (several yellow wedges) and other oil spills require small amounts of time (few yellow wedges). The time reported is thus relative time. Students will chart relative time according to the way they set up their scale. Most students will end up plotting number of wedges and translating number of wedges into broad categories such as "large," "medium," and "small" amounts of time. They may be able to make statements such as, “Method X takes about 6 times as long to clean up the oil as Method Y.” Some students may grasp these ideas quite easily. If this is the case with your students, you may want to introduce the term “relative time.”
-
Try to work with teams instead of the entire class on this step. It is likely that about half the teams will devise a way to record their observation without your help. This allows you to spend extra time with teams that need your attention. Make sure each student records all the data. Note that there is no single best way to record all the data from the simulation.
-
Making sense of complex data sets is a demanding mental task. Students sometimes are distracted from their goal and lose focus. Breaking the concepts into smaller statements helps keep their mental efforts on target. Some of these statements have parts that are incorrect. Have students identify the correct statements, and correct the statements with incorrect parts.
- When the thickness of an oil spill
decreases, its diameter increases.
- Bioremediation works by removing
the oil. Note that bioremediation works
best when chemical dispersing agents are added. Practically
speaking, bioremediation goes along with dispersing.
- Removing oil takes it out of the ocean. Dispersal
redirects oil to the water column or ocean floor.
- When the thickness of an oil spill
decreases, its diameter increases.
-
Monitor the TSAR process by walking around to each table. Become part of table-level conversation. Model appropriate advice-giving and revision-making.
The student version of How to Use the Think-Share-Advise-Revise (TSAR) Strategy.
The teacher version of How to Use the TSAR Strategy.
One strategy is to have all students read each passage.
Another strategy has each of 3 team members read one section and share with the other 2 team members what they learned.
Yet another reading strategy is to have students generate a 2-column table in their notebooks. The first column header is “Fact or idea from reading” and the second header is “Question I have about that fact or idea.”
Students will refer back to these readings as they build their final recommendations.