


Officer 2nd Justin E. Stumberg
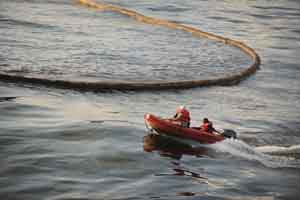
Burt begins solving his complex problem. He thinks about what he can do and what he cannot do to solve the problem. For example, Burt knows how to contain the oil first before removing it. He can accomplish this with a boom. (See figure 3-7.) A boom floats around the oil and keeps it from spreading. That makes recovering the oil easier.
Burt decides that efficient recovery means collecting as much of
the oil as possible while at the same time picking up as little
of the water as possible. He also decides that high performance
means recovering the oil fast. But Burt doesn’t have any
reliable data. He needs these data to test how oil recovery
technologies work. So Burt needs help designing a fair test. He
needs to test how performance is related to efficiency. He
should do this for various recovery technologies. And that’s
what you will do in this Explore activity, Recovery
Time.
Materials
-
Help Burt test the way oil spill cleanup technology works. Help him by completing his goal statement.
Goal statement: Test how oil spill cleanup works. Do this by finding out how _______ oil can be recovered. Also, find out how much __________ compared to _____________ can be recovered. Hint
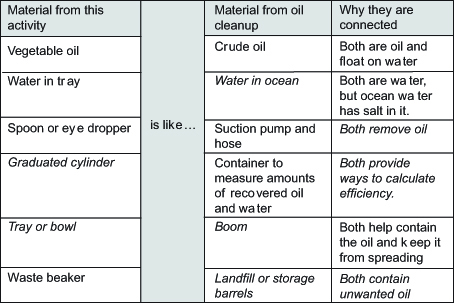
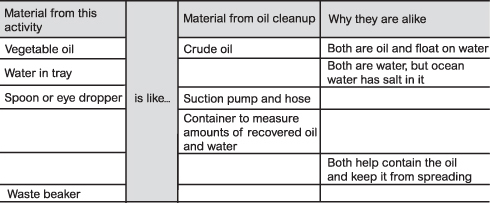
Discuss with a partner how to fill in the blank boxes of the table in figure 3-8. The analogy map shows how Burt connects materials in this activity to real-world oil cleanup equipment.
Brainstorm with classmates to list all the variables in this test. Read the Need to Know Variables if you need to. Your teacher will help the class categorize the list into independent, dependent, and control variables.
Watch and listen to your teacher share cautions and tips. Your teacher will share tips for using the materials in this activity.
Get a copy of the Recovery Time Data Table master. Form a consensus with your team on how you will complete the table. Hint
Conduct the test and complete the table based on your consensus discussion. By the end of the test, you should
- have numbers in each observation box
- list all control variables at the bottom of the table
- be ready to fill in numbers for the calculation boxes.
-
Follow your teacher’s example for completing the calculation boxes.
-
Place your calculations on the class chart. This chart is a large version of your data table. Your teacher will remind you how to determine the class average for each box.
Need to Know: Variables
You want to test how something works. In this case, you want to test how a cleanup technology works. Several different factors are involved in the test. There are different recovery rates. There are different amounts of oil and water you can recover. Even the amount of oil you recover can vary. Each of these factors is called a variable.
There are different types of variables to think about when you test how well things work. One type of variable is called the independent variable. The independent variable is what you are changing in your experiment. You might also think of it as what you are testing. Hint
Another type is a dependent variable. The dependent variable is what you are observing in your investigation. It depends on or responds to what you change in your investigation. Hint
Some of the variables should be kept the same in your test. These are all the variables that you are not testing. You should do everything you can to keep them constant. Keeping all the variables the same except for the one you are testing is what makes a test fair. Hint
Many experiments also need a control. A control is what you use to compare the tests. It is almost the same as what you are testing except that the independent variable does not change. Not all experiments have a control. It is not always possible to keep all the other variables constant when you are doing an experiment. That does not mean the test is not fair.
A final thing to consider when you are testing is how many times you try the test. If you only do one test, are you sure that the results are right? You usually need to try a test a few times to make sure you get similar results each time.
Activity Overview
In this Explore activity, Recovery Time, teams of students model an oil spill with vegetable oil in a tray of water. Then they recover the oil with a spoon or eye dropper. They investigate how fast they can remove it compared with the efficiency of removal. The efficiency is measured by the ratio of oil recovered to the total amount of oil plus water they recover. Lots of water in the recovery process is low efficiency. They make only preliminary interpretations of the data they collect.
Before You Teach
Background Information
Oil is less dense than water. It will float on top of water. Also, oil is not soluble in water. Oil concentrates into a thin disk-like shape on top of water. Very little water is part of the oil layer unless wave action or currents cause mixing. Mechanical devices such as pumps with hoses, skimmers, and sponge-like materials called sorbents can remove the oil layer. But the process removes water along with the oil. This is part of what makes the process only 80 percent efficient. The oil and water that is removed has to be separated, which adds to costs.
In this activity, students will only remove oil from the water. They will not then try to separate any water that remains from the oil they removed. Oil is usually contained by booms to make removing it easier. A bowl or tray will be the boom in this activity.
Materials
For each team of 3 students:
- 1 eye dropper
- 1 plastic spoon
- 1 100 mL or 50 mL graduated cylinder
- shallow tray or bowl
- access to tap water and sink
- 50 mL vegetable oil
- 1 250 mL beaker for waste
- 1 clock, large, with a second hand that is visible to all students (or 1 stopwatch per team)
- 3 pairs of safety goggles
- 3 copies of Master 3-1, Recovery Time Data Table
- metric ruler
Advance Preparation
Begin preparations well in advance. Vegetable oil is easy to obtain. Try to get as dark a color of oil as possible to help students see the oil as it floats on the water. For example, olive oil is usually darker than canola oil. The tray, bowl, lid, sauce pan, or casserole should have a diameter of approximately 12 inches or greater and be deep enough so that the oil slick does not touch the bottom. Make one copy per student of Master 3-1, Recovery Time Data Table. Have plenty of soap available for cleanup.
 Cautions
This investigation involves large amounts of water that could spill and result in a dangerously slippery floor. Ask students to be careful not to spill the water and to wipe up any spills immediately. You may want to have a mop available in the room.
At the end of the investigation, collect all oil and water in a disposable bottle or can and dispose of it in the trash.
As You Teach
Outcomes and Indicators of Success
By the end of this activity, students will
-
explore one way to model an oil spill.
They will explore how to model an oil spill by
- placing vegetable oil on top of water that is contained by a tray or bowl
- observing how oil floats on water
- observing how oil is not soluble in water.
-
conduct a fair test of recovery rate versus recovery efficiency.
They will conduct a fair test of recovery rate versus recovery efficiency by
- testing three oil removal rates
- measuring the amount of water and oil that is recovered
- placing their data properly onto a blank data table
- calculating a percent efficiency and class averages
Strategies
Getting Started
Start class by showing students some oil and water in a large graduated cylinder. Make sure everyone sees the layers and knows that the oil is on top. Then ask students to sketch what this would look like in a big body of water, for example, the ocean. Select a few sketches to introduce the idea of what an oil slick looks like. Explain how the oil spreads out as far as it can into as thin a layer as it can.
Next, ask students what efficient recovery means. Lead them to understand that in this context, efficient means lots of oil per amount of water. Show students how you can recover oil with a spoon or eye dropper and place it in a graduated cylinder. Show them how you get some water along with the oil no matter how careful you are. Tell them that efficiency can be expressed as a simple ratio—the amount of oil (top layer) divided by the amount of oil plus water.
Finally, ask students to anticipate whether a fast recovery or one that is slow and careful will lead to more water in the graduated cylinder. Have a few students share their thinking and why.
Process and Procedure
Remind students how important goals are in problem solving. Goals can keep us from spending extra time and mental energy on unproductive work. Then give students time to complete this goal statement. Debrief the entire class.
Make sure students understand how the oil spill model corresponds to real oil spills as shown in figure T3-1. Allow teams to work through this table, and debrief the whole class only if there is large-scale confusion.
Ask students to read the Need to Know about variables if they need to learn more about variables. Then remind students what variables are, and ask them to help you list all the ones they can think of while you write them for all to see and record. (See figure T3-2.)
Review some of the ideas you helped students think about from the Getting Started section of the teacher edition. These include the following:
- Oil floats on water.
- Oil is not soluble in water..
- Oil spills form a thin disk-like shape on water.
- Efficiency is the ratio of recovered oil to the amount of oil plus water.
- Some water is recovered no matter how careful one is.
- For 1 sample per 20 seconds, have the class look at a second hand or stop watch. Then show how you sample the oil carefully, placing it into the graduated cylinder.
- The 1 sample per 5 second rate will rush them, resulting in more water per sample.
- Remind them that they continue recovering oil until it is all gone. They will begin with new oil and water for each of 3 sampling rates.
- If you pool class data, you will not need multiple trials per team.
Give each student a blank copy of Master 3-1, Recovery Time Data Table. Lead a short class discussion regarding how students will fill in all blanks under the observations column. Emphasize that each student is responsible for all the data. Remind them that they will determine the recovery rate (independent variable) and measure how efficiency responds (dependent variable).
Try getting students to use their consensus discussion as a procedure of sorts in lieu of giving them an exact protocol to follow. Monitor teams as they conduct their test. Take time to look at data tables as you walk around. Remind students to list all controlled variables on the bottom.
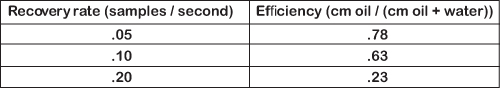
Demonstrate how to calculate the recovery rate in samples per second. Do this by dividing the number of samples (1) by the number of seconds between samples. For this test, the results are
- 1 sample / 20 seconds = .05 sample per second
- 1 sample / 10 seconds = .10 sample per second
- 1 sample / 5 seconds = .20 sample per second
Show students where to place team results on a class data sheet. Remind them how to calculate the averages and place that new information on their data tables.
Goal Statement: Test how oil spill cleanup works. Do this by finding out how fast oil can be recovered. Also, find out how much oil compared to water can be recovered.
Review how to differentiate between independent, dependent, and control variables. If you have completed another module in this program, Technology and the Diversity of Limits, Chapter 3, titled, "Testing Your Way to a Solution," remind students of what they learned about variables from that chapter. The Need to Know for this activity will provide another explanation of variables.
When the discussion is over, students should have the categories shown in Figure T3-2.
Hint See Figure T3-2 which identifies the independent (manipulated) variables for this activity.
In addition, demonstrate how to use an eye dropper or plastic spoon to recover oil. Do this by dipping the tool into the oil slick, removing a sample, and depositing the sample into the graduated cylinder.
Show them how to enact different sampling rates. For example,
Show them how to calculate efficiency of recovery. Do this by dividing the amount of oil by the amount of oil and water combined. An easy way to measure the amounts is to use a ruler. Stand the ruler next to the graduated cylinder. Then measure the height of the oil followed by the height of the oil plus water. Use centimeters to make calculations easier. When using a standard plastic spoon, the following are common results. (See figure T3-3.)