


Petty Officer 1st Class Zach Zubricki
In the Elaborate activity, a simulation and three readings gave you important additional information. That information was about oil spill cleanup technology. Now you can put together a solution to a complex problem. This means that you can provide workable choices to decision makers. Those people might be business executives, government officials, or community leaders. (See figure 3-22.)
In this Evaluate activity, Choosing a Solution, you will use skills and information you have learned in this chapter to give people realistic choices. The choices you present will be about ways to clean up an oil spill before it hits the shore. Materials
-
Select 1 constraint card from the container your teacher provides. Each card gives your team a set of constraints for an oil spill. These constraints come from the drop-down menus in the Oil Spill Technologies simulation.
-
Read the goal statement for this project. Talk about it as a team until you are sure what it means.
Goal statement: Explain all the reasonable choices for cleanup technologies. You only have to do this for your selected set of constraints. Hint
-
Review Steps 3a–d below. They represent 4 possible ways to explain your data to decision makers. Hint
- Make 2 bar charts (only for your constraints). The charts will both show “type of technology” on the horizontal axis. One chart will show “cost” on the vertical axis. The other chart will have “time to hit shore” on the vertical axis. You will have to record cost and time data.
- Fill in an Advantages and Disadvantages table (see figure 3-23) for each technology (contain and remove, disperse, bioremediation). Your teacher will provide you with a handout of this table. Tape or glue it into your technology notebook.
- Make a graph. You will plot “cost” on the horizontal axis. Plot “time to hit shore” on the vertical axis. You will have to record cost and time data.
- Write a presentation script. You will present your choices to stakeholders. Your presentation explains the realistic choices you recommend for your selected set of constraints. Your script includes evidence from readings and the simulation.
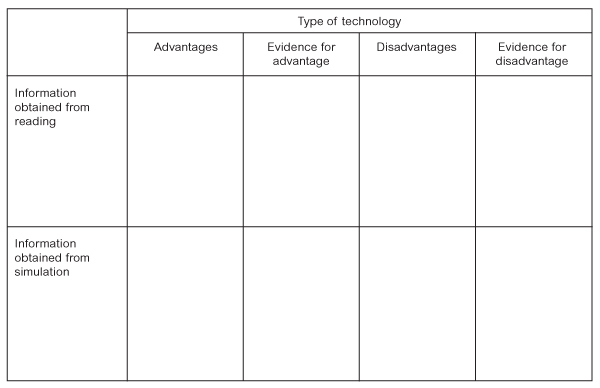 Figure 3-23: Advantages and Disadvantages table. You can use this table for 1 of your 4 explanation options.
 -
Choose 2 of the 4 ways to explain your data from Step 3. The methods are ways you choose to explain what you find out in the simulation. Your team does not have to do all 4. You only have to do 2 of the 4. Not every team will choose the same 2 methods.
Design a plan. The plan describes how you will do your selected ways of explaining from Step 4. Your plan must eventually address the project goal.
-
Conduct your plan and complete your chosen ways of showing your recommendations. Recommendations explain all the reasonable choices for cleanup for your set of constraints.
-
Meet with another team. Use your work as props or visual aids. Explain how you addressed the goal statement.
-
Ask the other team for advice. You will ask for advice on how to make your explanation more understandable and better address the goal statement.
-
Revise your work based on the other team’s advice before you hand it in to your teacher. Hint
Activity Overview
In the Evaluate activity, Choosing a Solution, teams suggest a solution to the complex problem of an oil spill. Teams begin by selecting a set of constraints that influence the solution in a particular direction. Student teams then use the simulation from the Elaborate activity to investigate which technology or combination of technologies should be used for the constraints given. Teams make recommendations based on the data they collect. They justify their recommendations by explaining them to stakeholders.
Before You Teach
Materials
For each class of 30 students:
- pens or pencils of different colors
- access to the Oil Spill Technologies simulation on a computer
- graph paper
- 30 copies of Advantages and Disadvantages
- 1 or 2 copies of Master 3-4, Constraint Cards (see Advance Preparation)
- tape or glue
Advance Preparation
Reserve your school’s computer lab or computer cart for 1 or 2 days, or make sure you have computers available in your room. Make copies of Master 3-3, Advantages and Disadvantages.
In this activity, teams suggest a solution to an oil spill. If you are short on time, make one copy of Master 3-4, Constraint Cards, and cut the cards apart. During the activity, teams will select one card that will describe the constraints of their oil spill. If you have more time, it is valuable to have each team take one Heavy crude card and one Light crude card so they can see the differences that result from spills made from each type of oil. If you choose to do the activity this way, make 2 copies of Master 3-4, cut them apart, and separate them into a Heavy crude set and a Light crude set. For durability and reuse in other classes, consider using cardstock or laminating the cards.
As You Teach
Outcomes and Indicators of Success
By the end of this activity, students will
- know that complex problems can be solved by breaking
them into smaller parts.
They will show they know this by
- running the simulation for their set of constraints
for each technology solution
- putting together simulation results from each
technology for a total solution.
- running the simulation for their set of constraints
for each technology solution
- explain solutions to complex problems using more than
one form of representation.
They will show their ability to explain complex solutions with more than one type of representation by choosing two of four reporting formats, each of which requires a different form of representation to complete.
Strategies
Getting Started
Start class by saying how impressed you are with students' progress toward solving this very complex problem (along with Burt).
Remind them of the steps they have already accomplished along the way.
They have activated prior knowledge about competing constraints and related this knowledge to a new situation involving the demands of Burt’s boss.
Students have broken down a big problem into smaller parts by first finding out all they can about containment and recovery technology.
They found out what was possible and what was not possible.
They learned how engineers explain their ideas. Engineers do this by taking a stand (claim), backing it up (using evidence), and justifying (giving a reason based on general trends or principles that govern similar problems).
Finally, they have practiced explaining other parts of the oil spill problem by collecting simulation data.
Process and Procedure
-
Place the prepared constraint cards into a container or two (if they are separated into heavy crude and light crude options).
-
You will have to model what you mean by “talk about.” Act out both on-target and off-target talk. Review what “reasonable” means. In this context, it refers to practical solutions that are possible. Reasonable does not always mean best. Several reasonable or workable solutions may be possible. Remind students that many real-world problems have a range of answers, not just one solution. Much of this activity is designed to let students experience this fact.
-
This step presents students with a choice for how they will accomplish the goal. Review each choice.
In choice 3a, remind them about how to make a bar chart. Sketch the axes for them and remind them that cost data shows up on the simulation.
In choice 3b, students complete the table on Master 3.3, Advantages and Disadvantages. Point out that it requires evidence for all information listed.
Choice 3c requires students to make an x-y or line graph from cost and time data. Remind them how the simulation provides this information, and then sketch the axes along with labels.
Finally, in choice 3d, students write a script of the explanation they imagine providing to stakeholders.
-
This step will be different for many students. Many are not used to having choice in their assignments. The choices are constructed such that by selecting any two, teams will have to explain their results in two forms or representations. Further, they will gain practice explaining like an engineer because they explain the same results twice.
-
Plans will vary depending on the choices teams have made. For each plan, students should have a clear indication of how they will collect data from the simulation, what data they intend to collect, how they will record and organize their results, and how they will address the goal statement. Ask students to have you approve their plans before they begin. This will save them time in the long run.
-
Monitor teams as they progress through their plan. Naturally, some teams will need more supervision than others. But when they choose the way to demonstrate their explanations, often motivation is greater. Remind them that their recommendations will be a range of answers, not a single, clear-cut solution.
-
Once they have completed their plan for both ways of representation, explain the value of explaining to someone else. Reasons include that practice often helps catch mistakes and gives confidence. In addition, getting advice from peers and being able to correct work before it is turned in to the teacher for grading usually results in a better grade.
-
This is a natural continuation of Step 7. Be sure to model what you mean by giving and receiving advice. Show examples of proper and improper advice. You can monitor these discussions for both individual and team assessment purposes.
-
Give students time to revise their work based on the other team’s advice. Show them ways to make revisions without having to redo the entire explanation.