


In the Explore activity, you thought about words related to the chance that something will happen; for example, the statements, “The Sun always rises in the east,” “The winds probably will increase later today,” “A snowstorm in July is not very likely in Florida,” and “There is a small chance that I will pass my history test without studying,” all have something in common. Each one describes the chance of an event happening (figure 3-7).
People use words like “never,” “always,” “sometimes,” or “often” when talking about the weather to explain patterns. The patterns allow them to make predictions. Sometimes, however, people would like more information than these words provide. Numbers can supply that additional information. People can use numbers to show how certain they are about their predictions. In this Explain activity, Probable Outcomes, you will learn about how people use numbers in predictions. You will also learn about probability—the likelihood that a future event will occur. Materials
-
In Steps 8–10 of the Explore activity, you read several statements and decided where to place them on a scale. The scale had both words and numbers on it. Do you think the words or the numbers were more helpful when making decisions about where to place the statements on the scale? Discuss your reasons with your teammates. Hint
-
Participate in the demonstration activity that your teacher will lead. Once your teacher has explained what will happen in the demonstration, make a prediction about the results.
-
In your technology notebook, write your best answers to the following questions. Be prepared to share your ideas in a class discussion.
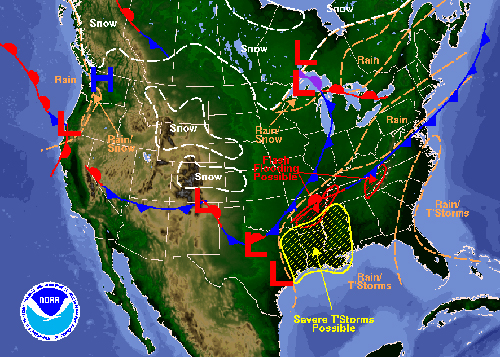
- Based on the data from this activity, how many days did it snow in Bozeman, Montana? (See figure 3-8.)
- The container used for this activity had a total of 50 white pieces (snow) and 50 red pieces (no snow). On how many of the 10 days would you expect to have snow?
- Did your class data match the prediction you made in Step 2?
- Why might the data from this activity not match your prediction?
- Remember that the container held 50 white pieces and 50 red pieces. What word would you use to describe the chance that you would select a red piece instead of a white piece?
- If the weather forecast says there is a 50 percent chance of snow in Bozeman tomorrow, can you say for sure that it will or will not snow?
- If you wanted to model a 60 percent chance of snow in Bozeman, what changes would you make to the colors of the pieces in the container? You should still have 100 pieces in the container.
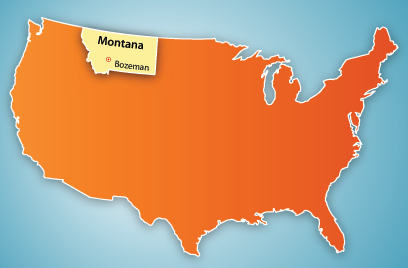 Figure 3-8: The forecast for Bozeman, Montana, calls for a chance of snow.
 -
Read the Stop and Think questions that are listed after Step 5. Keep the questions in mind as you read Statements of Probability. This reading will introduce you to how numbers can help people predict how likely something is to happen—or not happen.
Statements of Probability
If you flip a coin, you know that it will land on either heads or tails. After all, a coin has only two sides, and it has to land with either one side or the other facing up. If you flipped a coin several times, you would expect that it would be heads about half—or 50 percent—of the time, and it would be tails about half—or 50 percent—of the time. We cannot be as sure of the outcome of other things. You might wish that the weather forecaster could tell you whether or not it is going to rain or snow. Why do forecasters say that there is a 25 percent chance of rain? They say this because they do not know for certain.
People can use some types of patterns to make very accurate predictions. But other patterns, such as weather patterns, are not always as predictable. People do not always have enough information, and sometimes weather does not follow definite patterns. So sometimes people use the information they do know to predict what probably will happen.
Here is an example. Suppose one of your friends plays basketball 3 days a week but not always on the same days. Some weeks, she plays on Monday, Thursday, and Friday. Other weeks, she plays on Tuesday, Saturday, and Sunday. Now suppose someone asked you whether your friend will be playing basketball on a Thursday 3 months from now. Could you give a definite answer? No, because you do not have enough information to make the prediction—your friend has not established an exact pattern. But there is a general pattern. You know that your friend plays 3 days out of every 7. That is a little less than 50 percent of the days. So although you could not state for sure whether your friend will be playing on that Thursday, you could say something like, “There is a little less than a 50 percent chance that she will be playing basketball on that Thursday.”
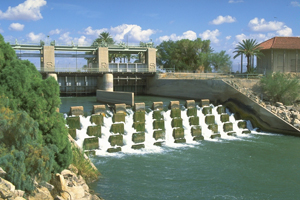 CorelFigure 3-9: When designers and engineers work together to design a dam like this one, they need to consider the natural events that are likely to happen that might damage the dam.
We call statements like this “statements of probability.” They are statements that indicate what could happen or how likely it is that an event may happen, but they do not say for sure whether anything will happen. Often you make decisions based on what you know. For example, think about going to a soccer game. If you knew it was going to rain, you could choose to go to the game and take a raincoat or umbrella. Or you could choose not to go to the game so you do not get wet. But people do not always know for sure whether it is going to rain. What if there were a 70 percent chance of rain? What if there were a 40 percent chance of rain? How would this affect your decision making?
If the weather forecaster says there is a 20 percent chance of rain, it might be reasonable to go ahead with your outdoor event. That is because a probability of 20 percent, or 20 out of 100 (2 in 10) is less than a “50:50” chance of rain. If the probability of rain were 80 percent, you would be much more likely to get rained on!
Engineers must also consider what might happen when they create designs. For example, California is known for earthquakes. When engineers and architects design buildings there, they consider the fact that there is a high probability of earthquakes. They add features to their designs to prevent damage to the buildings if an earthquake strikes. The dam in figure 3-9 is another example where engineers must consider possible natural events. Which natural events do you think would have a high probability of occurring near the dam?
If you need more information about percentages and what they mean, read How to Make Sense of Percentages. You will use percentages in the upcoming investigation.
 Stop and Think
Check your understanding of probability by answering the following questions. Write your answers, including your explanations, in your technology notebook.
- What is the chance that the next baby born in your town’s hospital will be a girl?
- Suppose that the last 15 babies born in the hospital were boys. What is the chance that the next baby born in your town’s hospital will be a boy?
- What is your chance of winning a drawing if you bought 5 of the 100 tickets sold?
- What is your chance of winning if you bought 25 of the 100 tickets sold?
- Imagine the typical die with six sides labeled from 1 to 6. What is the chance of rolling a 1, a 3, or a 5 (not a 2, a 4, or a 6)?
Join with your teammates to complete It’s in the Bag, a simulation that has three parts. In these investigations, you will learn more about how numbers are important for predictions. Hint
As you work through each part, record the data on Master 3-2, Keeping Track of the Numbers.
Stop and Think
Work by yourself to answer the following questions in your technology notebook. Then discuss your ideas with your teammates.
-
In each part of the simulation, It’s in the Bag, the pieces that were drawn out were added back into the bag before the next selection. (The same is true for the demonstration your teacher led.) How would the chance of snow in Bozeman change if you selected two white pieces and did not put them back before the third drawing?
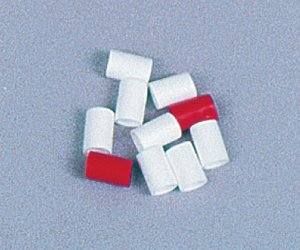 Figure 3-10: In this pile, 20 percent (or 2 out of 10) of the pieces are red.
 Initially, there were 10 pieces in the bag. Two were red, and eight were white.
What percentage of the pieces in the bag were red?
Two white pieces were drawn.
How many red pieces were left in the bag?
How many white pieces were left in the bag?
What is the total number of pieces left in the bag?
What is the percentage of red pieces in the bag now?During the simulation, it might have seemed that a 20 percent chance of snow was a low risk for snow but that a 3 percent chance was a high risk for a major earthquake. Why might people think differently about the probability of these two events?
The following information should help you with your answer:
Participate in a class discussion to discover how your team’s results compare with those of other teams.
Activity Overview
In the Engage and Explore activities, students began thinking about how people discuss the chance or likelihood of a future event occurring, including weather events.
In this Explain activity, Probable Outcomes, students are introduced to probability, a more quantitative method of communicating about chance. They will begin this activity by participating in a class activity. They will then work though a simulation to learn more about probability.
Before You Teach
Background Information
This Explain activity introduces students to the concept of probability. Probability is introduced in the context of percentages, for example, 1 chance out of 100 (1 percent), or 10 chances out of 100 (10 percent).
Students will use red and white plastic pieces (either physical pieces or virtual pieces in the online simulation) to represent probabilities. For example, students will read that the chance of a snowstorm is 20 percent. Using 10 plastic pieces, they should put two white pieces and eight red pieces into a container. The white pieces represent the occurrence of a snowstorm.
Interpreting probability is an important skill to introduce to students because all of modern society uses numerical predictions. People base everything from prescription dosages to election predictions on probability. Sometimes people use probability statements to misrepresent information. Recognizing and interpreting statements of probability are important and useful skills. An understanding of probability is also a key concept in mathematics.
Materials
For each student:
- 1 copy of Master 3-2, Keeping Track of the Numbers
For the demonstration:
- 50 white plastic pieces
- 50 red plastic pieces
- a bag or container (opaque so students cannot see into it) from which to draw the pieces
For each team of 2–3 students:
- access to the It's in the Bag simulation on computers
Advance Preparation
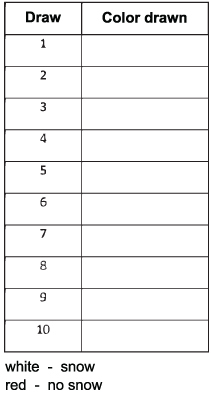
Collect the plastic pieces that you need for the demonstration and put them in the bag or container. Plastic chips or pop beads work well. Before class begins, draw a chart like the one in figure T3-1 on the board. You will use this chart to record information during the class activity described in Step 2.
Make 1 copy per student of Master 3-2, Keeping Track of the Numbers.
As You Teach
Outcomes and Indicators of Success
By the end of this activity, students will develop an understanding of the concept of probability.
They will demonstrate their understanding by
- defining probability as “a measure of the likelihood that something will happen in the future”
- interpreting the results obtained from using a model
- explaining why the outcomes indicated by a model may not match the predicted outcome
- explaining that a high probability does not mean that an event is certain to happen
- describing how they would change the model to reflect a different probability.
Strategies
Getting Started
Have students read the chapter organizer. They should read the linking question, which helps them make the connection between the Explore activity and this activity, although they will not be able to answer the question until they complete this activity. They should also read the key idea of this activity.
Process and Procedure
-
Begin the activity by asking students to reflect on the scales they used during the Explore activity. In one case, they placed words and events on a scale that ranged from a low chance to a high chance. In the other case, the scale included numbers ranging from 1 to 10. Ask students to share their thoughts about whether the numbers helped them place events on the scale.
-
Lead the class in an activity to introduce the idea of probability. Show the bag or container that you prepared in advance to the class, but do not tell students how many pieces are in the container. Explain that this activity will allow students to learn the weather in Bozeman, Montana, where for 10 days in a row there is a 50 percent chance of snow. Explain that if a student draws a white piece, it means snow; if a student draws a red piece, it means no snow. Give students time to make a prediction about how many days it will snow. Make sure they write their predictions in their technology notebooks.
Ask 10 different students to draw a piece out of the container to represent the 10 days. Note aloud whether each piece is red or white. Ask for a volunteer to record the information in the chart on the board. Make sure that students put the plastic pieces back into the container before the next piece is drawn so that the probability is always 50 percent (equal numbers of red and white pieces).
-
After the chart is filled in with the data from the activity, allow time for students to analyze the information and answer the questions in Step 3. Then, hold a class discussion to allow students to share their responses and ask any questions they may have about analyzing the data.
-
Based on the data from this activity, how many days did it snow in Bozeman?
Students should be able to state the number of days (out of 10) that it snowed in Bozeman by counting the number of white pieces drawn from the container.
-
The container used for this activity had a total of 50 white pieces (snow) and 50 red pieces (no snow). On how many of the 10 days would you expect to have snow?
If there are equal numbers of white and red pieces in the container, students would expect to draw a white piece about half, or 50 percent, of the time. Therefore, they would expect 5 days of snow using this model.
-
Did your class data match the prediction you made in Step 2?
It is likely that the class data will not exactly match the predicted number of days.
-
Why might the data from this activity not match your prediction?
The model relies on the chance of drawing a white piece instead of a red piece from the container. Each time a student draws from the container, the student has an equal chance of drawing a white piece or a red piece. Just because a student drew a white piece with one turn does not mean that the next selection will always be the opposite color.
-
Remember that the container held 50 white pieces and 50 red pieces. What word would you use to describe the chance that you would select a red piece instead of a white piece?
Students could say that the chance is 50/50, or an even chance.
-
If the weather forecast says there is a 50 percent chance of snow in Bozeman tomorrow, can you say for sure that it will or will not snow?
A 50 percent chance of snow indicates that the chance of snow is the same as the chance of not having snow.
-
If you wanted to model a 60 percent chance of snow in Bozeman, what changes would you make to the colors of the pieces in the container? You should still have 100 pieces in the container.
Using this setup, students would need to change the number of pieces of each color in the container. If the container again held a total of 100 pieces, they would want 60 of them to be white. Even if students do not know the specific number of each color, look for signs that they understand that there should be more pieces that represent snow than pieces that represent no snow.
-
-
Ask students to read the Stop and Think questions and the Statements of Probability. Encourage them to make notes while they are reading as they encounter information that will help them answer the questions.
-
If your students need more information about percentages, have them read How to Make Sense of Percentages before answering the Stop and Think questions. The teacher version of How to Make Sense of Percentages can be found at this link.
Answers to Stop and Think Questions
-
What is the chance that the next baby born in your town’s hospital will be a girl?
The next baby born in the town’s hospital will either be a boy or a girl. Students would expect that there is an equal chance for each sex. Therefore, they would expect that there is a 50 percent chance that the next baby will be a girl.
-
Suppose that the last 15 babies born in the hospital were boys. What is the chance that the next baby born in your town’s hospital will be a boy?
As in the previous question, there is a 50 percent chance that the next baby born will be a boy. The fact that the last 15 babies were all boys is highly unusual, but it does not affect the probability of the sex of the next baby born.
-
What is your chance of winning a drawing if you bought 5 of the 100 tickets sold?
The chance of winning a drawing if students bought 5 out of a total of 100 tickets sold would be 5 percent (5 out of 100).
-
What is your chance of winning if you bought 25 of the 100 tickets?
If students bought 25 out of 100 tickets, the chance of winning would be 25 out of 100, or 25 percent.
Questions 3 and 4 use very simple numbers to make the math fairly easy. However, imagine a multistate lottery game in which a person who buys a ticket has a 1 in 100 million chance of winning. That person may think that if he or she buys a second ticket, the odds of winning will be twice as good. In reality, the chance of winning has improved to only 2 in 100 million.
-
Imagine the typical die with six sides labeled from 1 to 6. What is the chance of rolling a 1, a 3, or a 5 (not a 2, a 4, or a 6)?
The chance of rolling a 1, a 3, or a 5 is 50 percent.
Process and Procedure (continued)
- Explain to students that
they will work through a simulation on the computer to practice
using what they have learned about probability. Give each
student a copy of Master 3-2, Keeping Track of the Numbers.
Students will work in teams of two to three for this activity.
There is a print button on some screens of the simulation. If you would prefer to not use Master 3-2, you can instruct your students to print the pages from the simulation instead. The only pages they will be able to print are the last screen of each part of the simulation which show the input of their work. If you have them print the screens and turn them in, it is best to have them turn in one set for their group.
Ask students to answer the Stop and Think questions when they have completed the It’s in the Bag simulation.
Answers to Stop and Think Questions
-
In each part of the It’s in the Bag simulation, the pieces that were drawn out were added back into the bag before the next selection. (The same is true for the demonstration your teacher led.) How would the chance of snow in Bozeman change if you selected two white pieces and did not put them back before the third drawing?
The following information should help you with your answer:
-
Initially, there were 10 pieces in the bag. Two were red, and eight were white.
What percentage of the pieces in the bag were red?
Initially, 20 percent of the pieces in the bag were red.
-
Two white pieces were drawn.
How many red pieces were left in the bag?
After drawing two white pieces, there were still two red pieces in the bag.
How many white pieces were left in the bag?
If two white pieces were drawn out of the bag, there would be six white pieces left.
What is the total number of pieces left in the bag?
After drawing two white pieces out of the bag, there would be a total of eight pieces left in the bag.
What is the percentage of red pieces in the bag now?
After drawing two white pieces out of the bag, the percentage of red pieces left in the bag would be 2 out of 8, or 2 ÷ 8 = 0.25, or 25 percent. Therefore, any future draws from the bag would have a different probability than if there are always 10 pieces in the bag (two red and eight white).
The main point to this question is that if you change the total number of pieces in the bag, you would also be changing the probability of an event happening. If you did not replace the two white pieces after drawing them from the bag, the probability of having no snow would change from 20 percent to 25 percent. If you continued to draw pieces without replacing them, the probability would continue to change.
-
-
During the simulation, it might have seemed that a 20 percent chance of snow was a low risk for snow but that a 3 percent chance was a high risk for a major earthquake. Why might people think differently about the probability of these two events?
People might have different thoughts about the risk for these two events because of the impact that each type of event may have. A 20 percent chance of snow may seem like a relatively low risk because snow usually does not create a major disruption in people’s lives. On the other hand, a 3 percent chance of a major earthquake may be interpreted as a high risk because of the damage and potential harm that this event may cause, and because it could have a long-lasting effect on people’s lives.
Process and Procedure (continued)
- Hold a class discussion to review students’ results from the simulation and their answers to the Stop and Think questions.