


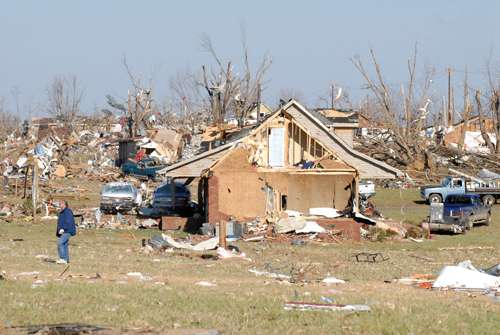
One of the natural events that you learned about in the Explain activity was tornadoes. You may have heard about tornadoes that have struck some part of the country. You may have seen pictures of the tornadoes or the damage they caused. (See figure 2-40.) It might seem that tornadoes just “appear” out of a cloudy sky, but there are patterns to when and where tornadoes occur. If scientists can learn more about weather patterns that are closely associated with tornadoes, they may be able to predict them more accurately. If so, the number of people who are injured or die from tornadoes may decrease. In this Elaborate investigation, Twisters, you will learn about tornado occurrences. What patterns do you find? Materials
-
Set up your technology notebook for a new activity. Make sure you include the activity title and the date. Add this activity to your table of contents.
-
In this activity, you will study data to learn more about where tornadoes occur. Retrieve the colored pencils or markers that your team needs for the activity.
-
With your teammates, work through the steps in the master titled Tornado Data Set 1. Discuss the questions with your teammates. Hint
-
After you have finished Tornado Data Set 1, work with your teammates to analyze the data in either Tornado Data Set 2 or Tornado Data Set 3. Your teacher will let you know which data set you will work with.
-
Participate in a class discussion about the tornado data sets. You should be prepared to share your answers about the data.
Activity Overview
In the Elaborate activity, Twisters, students will examine data about the occurrence of tornadoes in the United States. Through this data analysis, they will learn that some regions of the country experience more tornadoes than do other regions. They will also learn that tornadoes are more likely to happen at certain times of the year and at certain times of the day.
Before You Teach
Materials
For each team of 3 students:
- 3 copies of Master 2-3, Tornado Data Set 1
- 4 pencils or markers of different colors (blue, green, yellow, red)
- 3 copies of either Master 2-4, Tornado Data Set 2, or Master 2-5, Tornado Data Set 3 (half of the teams will analyze data set 2, and half of the teams will analyze data set 3)
- 3 copies of Master 2-6, Tornado Data Set 4 (optional)
Advance Preparation
Make 1 copy of Master 2-3, Tornado Data Set 1 for each student. Make enough copies of Master 2-4, Tornado Data Set 2 and Master 2-5, Tornado Data Set 3 so that half of the class receives data set 2 and half receives data set 3. Decide whether you would like to challenge your students with Master 2-6, Tornado Data Set 4 and make copies as needed.
As You Teach
Outcomes and Indicators of Success
By the end of this activity, students will be able to identify different patterns of tornado occurrence.
They will show their ability by
- analyzing data about the occurrence of tornadoes in the United States
- describing the patterns they see in the data.
Strategies
Getting Started
Have students look at the chapter organizer and determine what they have learned so far in the chapter. Help them transition to this activity by reminding them that, during the Engage activity in this chapter, they thought about which types of natural events were more likely to occur in their area. In the Explain activity, they learned about different kinds of natural events, their causes, and their impact. They also read some information about where the different events occur in the world. Tell them that they will now examine the patterns of one type of natural event: tornadoes. Ask them if they remember the definition of the word pattern. Before they begin working through the data, make sure they understand that a sequence of events that happens over and over again in a predictable manner is a type of pattern.
The data used in this activity show the average number of tornadoes that occur in a given state during different months of the year or at different times of the day. If students need to review averages, you may want them to work through How To Average Numbers. The teacher version of this How To is at this link.
Process and Procedure
-
In Step 1, students should set up a new entry in their technology notebooks.
- Ask students to work in their
teams of three for this activity. Have all teams start by
working through the instructions on Master 2-3, Tornado Data Set 1. For this set
of data, students are asked to use different-colored pencils or
markers to color-code states with different numbers of
tornadoes. They do not need to color in the entire state; they
can merely highlight the state name. They can discuss their
answers to the questions on the handout before writing their
answers.
The hint for this step suggests that students can use the How To titled How to Average Numbers. The teacher version of How to Average Numbers offers additional support for this topic. -
What does it mean that the numbers on the map are the average number of tornadoes in one year in each state?
If students understand what an average is, they should recognize that this is not the exact number of tornadoes that the state will have each year. Rather, the averages on this map are based on the number of tornadoes that have occurred in that state during a period of more than 50 years between 1953 and 2004. By using average data, people can get a better idea of the usual number of tornadoes that occur during a year. For example, consider a state that had 20 tornadoes in the previous year. That could be either well within the usual range for the state or it could be very unusual (if the state had on average 2 tornadoes a year). By using averages, you can better account for years that have an unusually high or unusually low number of tornadoes.
-
On average, the five states with the most tornadoes each year are
Texas, Oklahoma, Kansas, Florida, and Nebraska.
-
On average, five of the states that have the fewest tornadoes each year are
More than five states have very few tornadoes. Students’ lists may vary, but states with a low average number of tornadoes include Alaska, Hawaii, Nevada, Maryland, Delaware, Connecticut, Washington, and Oregon.
-
Do you see any patterns about where tornadoes occur? If so, describe the patterns.
Students are likely to notice that many of the states in the center of the country (east to west) have a higher average number of tornadoes each year. The average number of tornadoes each year is fairly low for states in the western part of the country. Another observation is that there are very few states that have zero tornadoes each year on average.
-
Decide whether the following sentences are true or false. Then explain your answer.
-
Colorado has 22 tornadoes every year.
This is a false statement. Colorado does experience an average of 22 tornadoes each year. The data do not show what happens each year. Colorado may have more tornadoes in some years and fewer tornadoes in other years.
-
Alaska never has tornadoes.
This is a false statement. According to the data for 1953–2004, Alaska experiences an average of 0 tornadoes each year. This does not mean that Alaska has not had any tornadoes during this time. In fact, tornadoes have occurred. From the average, however, you can determine that tornadoes are not frequent in Alaska and that the average number over the time period has been rounded down to 0.
-
In any one year, there could be more tornadoes in Kentucky than there are in Indiana.
This is a true statement. Again, the data on this map show the average number of tornadoes during a year. On average, Indiana experiences more tornadoes during a year (22) than does Kentucky (12). However, during one specific year, Indiana could have a lower-than-average number whereas Kentucky could have a higher-than-average number.
-
Answers to Questions on Master 2-3, Tornado Data Set 1
-
For the next step, half of the teams should analyze Master 2-4, Tornado Data Set 2 and half of the teams should analyze Master 2-5, Tornado Data Set 3.
-
Hold a class discussion and go over all the tornado data. Teams that worked on Tornado Data Set 2 should explain their findings to the students who worked on Tornado Data Set 3, and vice versa. As part of the discussion, ask students if and how the tornado data help reveal a pattern. By the end of the discussion, all should recognize that tornadoes are more likely to occur in some parts of the country than in others, and that tornadoes are more common during certain times of the day and during certain months of the year. They should understand that just because the average number of tornadoes is 0 for a given state, time of day, or month, there is still a chance for tornadoes to occur. The numbers are averages. Tornadoes can (and do) occur in all 50 states, during each month of the year, and at all times of the day.
-
At what time of day did the greatest number of tornadoes occur?
According to the information on the graph, tornadoes occurred most frequently around 5 P.M.
-
At what time of day did the fewest number of tornadoes occur?
According to the graph, tornadoes did not occur at 3 A.M. or at 8 A.M.
-
Do you see any patterns in the data? Describe the patterns.
Tornadoes are most frequent in the late afternoon and early evening. Tornadoes are less frequent during the early morning hours.
-
Based on the data, tornadoes are most likely to happen
_____ in the morning.
_____ at noon.
__X__ in the afternoon.
__X__ in the evening.
_____ at night.
-
The graph shows that no tornadoes occurred at 3:00 A.M. Can you conclude that tornadoes never occur at 3:00 A.M.? Explain your answer.
You cannot conclude that tornadoes never occur at 3:00 A.M. The data indicate only that tornadoes did not occur at 3:00 A.M. in this location during the time period included in this data set. In fact, tornadoes can occur at any time of the day.
-
On average, which month has the greatest number of tornadoes?
May has the highest average number of tornadoes.
-
On average, which month has the fewest number of tornadoes?
January, February, and December all have a low average number of tornadoes.
-
Do you see any patterns in the data? Describe the patterns.
Tornadoes are most frequent from April to September. The months with the highest average number of tornadoes are May and June.
-
What conclusion can you make from these data about when tornadoes are more or less likely to occur?
Tornadoes can occur at any time of the year, although they are more frequent in spring and summer than they are in fall and winter.
Answers to Questions on Master 2-4, Tornado Data Set 2
Answers to Questions on Master 2-5, Tornado Data Set 3
Extension Activity
To further analyze data about tornadoes, students can use Master 2-6, Tornado Data Set 4. This optional data set shows the average number of tornadoes that occurred in a 10,000 square mile (sq mi) area during one year in each state for the years 1953-2004. This way of presenting the data takes into account that states vary in size. You would expect that larger states have a greater number of tornadoes. By analyzing data for the number of tornadoes per 10,000 sq mi area, you can compare areas of equal size.
-
On average, the five states with the most tornadoes per 10,000 sq mi area each year are
Florida, Oklahoma, Kansas, Iowa, and Illinois.
-
On average, five of the states that have the fewest tornadoes per 10,000 sq mi area each year are
Alaska, Oregon, Washington, Nevada, Utah, Idaho, and Montana.
-
Do you see any patterns about where tornadoes occur? If so, describe the patterns.
Similar to the average total number of tornadoes in a state annually (Tornado Data Set 1), these data show that the central areas of the country have a higher incidence of tornadoes than do other parts of the country. The southeastern part of the country and some states along the east coast also have a higher average number of tornadoes. Many states in the western part of the country have a lower average number of tornadoes per 10,000 sq mi area.
-
Tornado Data Set 1 gave you information about the average number of tornadoes in each state for one year. Tornado Data Set 4 gave you information about the average number of tornadoes in a 10,000 sq mi area in each state for one year.
- How were your conclusions alike or different for the two sets of data?
- Are there advantages to seeing both sets of data?
There were some similarities revealed in the two data sets. In each case, states in the more central areas (east to west) had a higher average number of tornadoes. However, when analyzing the data by 10,000 sq mi areas, it could be seen that some of the other states in the southeast and along the east coast had a higher average than might be expected. The primary advantage in examining the data by 10,000 sq mi area is that differences in the size of the different states can be accounted for.